How the livability score works
The livability score is a 0–100 composite index built from five signal groups: safety (crime pressure at LSOA level), education (school quality and proximity), deprivation (IMD decile distribution), employment (economic activity rates) and property market health (transaction volume and price stability). Each signal is normalised to a common scale and weighted to produce a single borough-level score. Higher is better.
Median property prices are rolling 12-month sector medians drawn from Land Registry transaction data, aggregated to borough level. This smooths out seasonal spikes and gives a more representative picture of what buyers are actually paying in each borough right now.
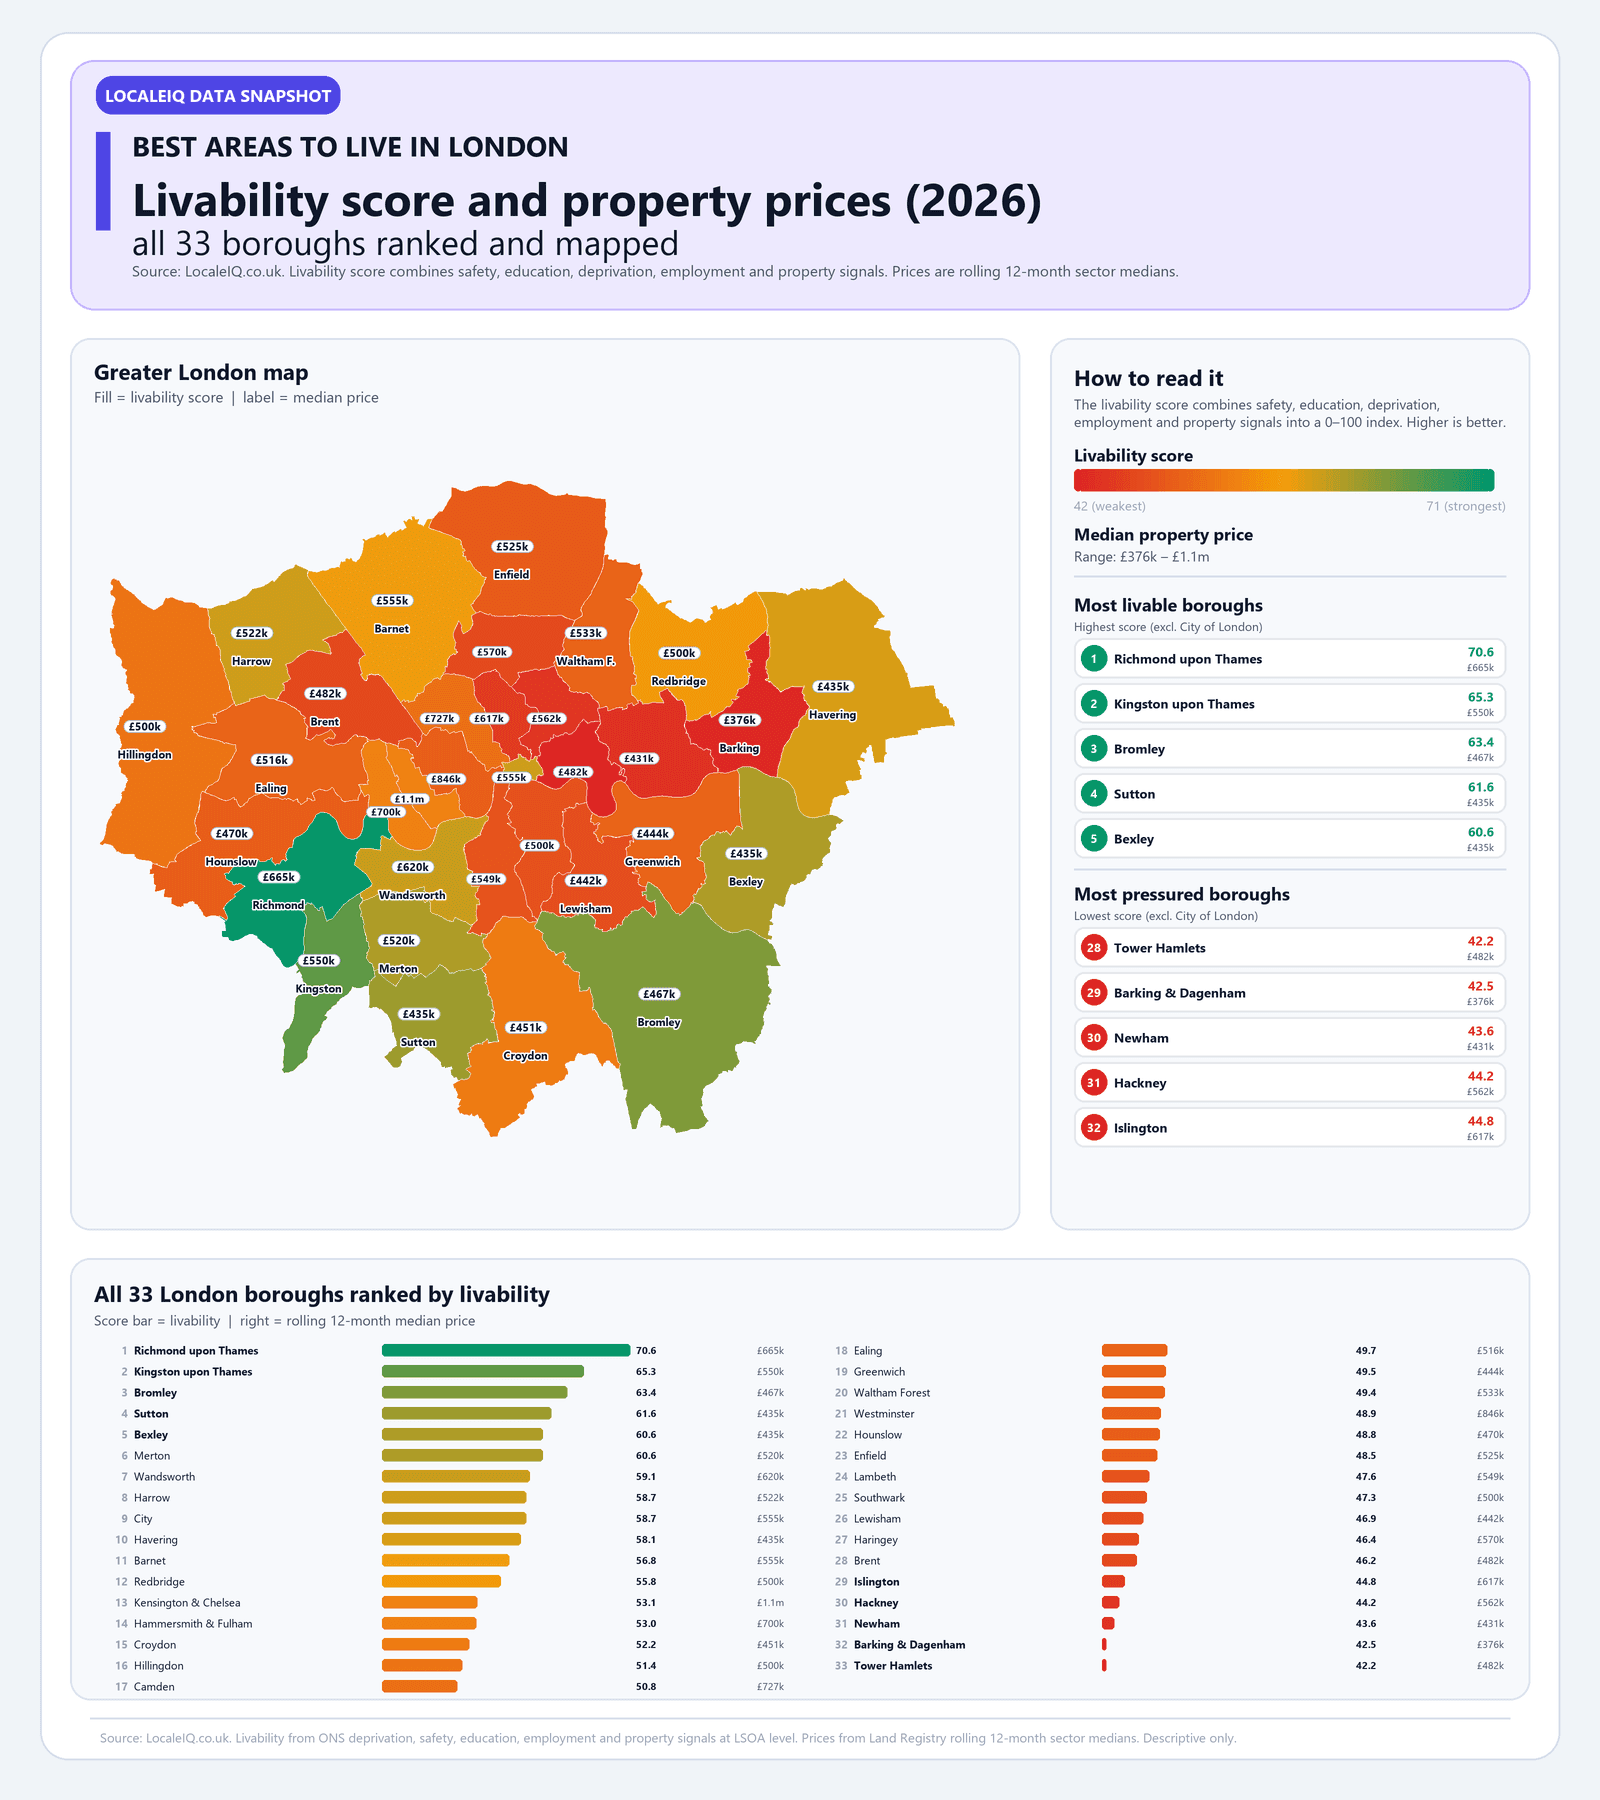
The infographic below maps both metrics at once: borough fill colour shows the livability score (green is strongest, red is weakest), while the white price labels show median transaction price. Click the image to zoom in and explore individual boroughs.
The five most livable London boroughs in 2026
Richmond upon Thames leads the ranking with a livability score of 70.6, driven by the lowest crime pressure in London, strong schools and low deprivation. Its median property price of £665k reflects that demand. Kingston upon Thames (65.3) follows a similar pattern: outer south-west London, low crime, good schools, median price £550k.
Bromley (63.4, £468k), Sutton (61.6, £435k) and Bexley (60.6, £435k) round out the top five. All three are outer boroughs with a suburban character, relatively low crime pressure and prices well below the London average. For buyers who can accept longer commute times, these boroughs offer the strongest livability signals per pound spent.
Merton (60.6, £521k) narrowly misses the top five and offers a useful comparison: similar livability to Bexley but £85k more expensive, reflecting its closer proximity to central London and stronger transport links.
Top 10 London boroughs by livability score (2026)
| Borough | Livability | Median price | Total sales (12m) |
|---|---|---|---|
| Richmond upon Thames | 70.6 | £665,000 | 2,377 |
| Kingston upon Thames | 65.3 | £550,000 | 2,204 |
| Bromley | 63.4 | £467,500 | 3,971 |
| Sutton | 61.6 | £435,000 | 2,342 |
| Bexley | 60.6 | £435,000 | 2,913 |
| Merton | 60.6 | £520,500 | 2,617 |
| Wandsworth | 59.1 | £620,000 | 4,436 |
| Harrow | 58.7 | £522,500 | 1,776 |
| City of London | 58.7 | £555,000 | 13 |
| Havering | 58.1 | £435,000 | 2,830 |
The most pressured boroughs: where livability scores are lowest
Tower Hamlets has the lowest livability score in London at 42.2, weighed down by high crime pressure, elevated deprivation and dense mixed-use streets. Its median price of £483k is mid-range for London, which means buyers pay a moderate price for a weaker living-conditions signal. Barking and Dagenham (42.5, £376k) scores almost as low but costs significantly less, making it London's most affordable borough by median price.
Newham (43.6, £432k), Hackney (44.2, £563k) and Islington (44.8, £618k) complete the bottom five. Hackney and Islington are notable outliers: their prices are among the highest in the bottom group, driven by proximity to the City, strong cultural identity and gentrification pressure. Buyers in these boroughs are paying a premium for location despite below-average livability signals.
The gap between the top and bottom is 28 points on a 100-point scale. That is large enough to represent a materially different daily experience in terms of safety, school access and neighbourhood deprivation.
5 lowest-scoring London boroughs by livability (2026)
| Borough | Livability | Median price | Crime pressure |
|---|---|---|---|
| Tower Hamlets | 42.2 | £482,500 | 67.1 |
| Barking and Dagenham | 42.5 | £376,000 | 63.7 |
| Newham | 43.6 | £431,500 | 66.6 |
| Hackney | 44.2 | £562,550 | 64.0 |
| Islington | 44.8 | £617,500 | 63.3 |
Price vs livability: where you get the most for your money
The relationship between price and livability is not linear. Some boroughs offer strong livability at a relatively low price; others charge a premium for weaker signals. Understanding this trade-off is the practical value of the ranking.
Sutton (£435k, score 61.6) and Bexley (£435k, score 60.6) are the clearest value picks: top-five livability at bottom-quartile prices. Bromley (£468k, 63.4) and Havering (£435k, 58.1) are close behind. All four are outer-south or outer-east boroughs where suburban character keeps both crime and prices lower.
At the other extreme, Kensington and Chelsea (£1.05m, score 53.1) and Westminster (£846k, 48.9) are the most expensive boroughs but sit in the middle or lower half of the livability ranking. You are paying for prestige, central location and international demand rather than livability fundamentals.
Camden (£728k, 50.8), Islington (£618k, 44.8) and Hackney (£563k, 44.2) fall into a similar pattern: inner-London premiums driven by cultural capital and transport access, with livability scores that do not match the price tag.
Full borough ranking: all 33 boroughs by livability
The table below ranks every London borough by livability score, with median property price, population and 12-month sales volume. Use it to compare any pair of boroughs or to find where a specific area sits in the London-wide distribution.
All 33 London boroughs ranked by livability score (2026)
| Rank | Borough | Livability | Median price | Population | Sales (12m) |
|---|---|---|---|---|---|
| 1 | Richmond upon Thames | 70.6 | £665,000 | 195,306 | 2,377 |
| 2 | Kingston upon Thames | 65.3 | £550,000 | 168,033 | 2,204 |
| 3 | Bromley | 63.4 | £467,500 | 330,007 | 3,971 |
| 4 | Sutton | 61.6 | £435,000 | 209,582 | 2,342 |
| 5 | Bexley | 60.6 | £435,000 | 246,494 | 2,913 |
| 6 | Merton | 60.6 | £520,500 | 215,172 | 2,617 |
| 7 | Wandsworth | 59.1 | £620,000 | 327,549 | 4,436 |
| 8 | Harrow | 58.7 | £522,500 | 261,217 | 1,776 |
| 9 | City of London | 58.7 | £555,000 | 8,588 | 13 |
| 10 | Havering | 58.1 | £435,000 | 261,995 | 2,830 |
| 11 | Barnet | 56.8 | £555,000 | 389,365 | 3,477 |
| 12 | Redbridge | 55.8 | £500,000 | 310,274 | 2,432 |
| 13 | Kensington and Chelsea | 53.1 | £1,050,000 | 143,365 | 1,455 |
| 14 | Hammersmith and Fulham | 53.0 | £700,000 | 183,161 | 1,946 |
| 15 | Croydon | 52.2 | £451,500 | 390,747 | 4,215 |
| 16 | Hillingdon | 51.4 | £500,000 | 305,871 | 2,582 |
| 17 | Camden | 50.8 | £727,500 | 210,163 | 1,724 |
| 18 | Ealing | 49.7 | £516,250 | 367,130 | 2,735 |
| 19 | Greenwich | 49.5 | £444,625 | 289,057 | 2,855 |
| 20 | Waltham Forest | 49.4 | £533,750 | 278,444 | 2,845 |
| 21 | Westminster | 48.9 | £846,250 | 204,214 | 1,811 |
| 22 | Hounslow | 48.8 | £470,000 | 288,200 | 2,046 |
| 23 | Enfield | 48.5 | £525,000 | 329,987 | 2,677 |
| 24 | Lambeth | 47.6 | £549,000 | 317,668 | 3,755 |
| 25 | Southwark | 47.3 | £500,000 | 307,623 | 3,020 |
| 26 | Lewisham | 46.9 | £442,875 | 300,568 | 3,601 |
| 27 | Haringey | 46.4 | £570,000 | 264,227 | 2,365 |
| 28 | Brent | 46.2 | £482,400 | 339,824 | 2,327 |
| 29 | Islington | 44.8 | £617,500 | 216,608 | 2,114 |
| 30 | Hackney | 44.2 | £562,550 | 259,112 | 2,111 |
| 31 | Newham | 43.6 | £431,500 | 351,069 | 1,851 |
| 32 | Barking and Dagenham | 42.5 | £376,000 | 218,868 | 1,389 |
| 33 | Tower Hamlets | 42.2 | £482,500 | 310,322 | 2,225 |
How to use this ranking when choosing where to live
Borough rankings are a first filter, not a final answer. They tell you which parts of London are worth investigating and which are likely to sit outside your requirements before you spend time on viewings. A borough with a livability score below 45 and a median price above £550k deserves scrutiny: you are paying above-average prices for below-average conditions.
The next step is postcode-level comparison. LocaleIQ lets you search any London postcode and see safety, deprivation, school quality, planning applications and property signals layered on the same map. That turns a borough-level shortlist into a street-level decision.
Property prices within a single borough can vary by 40–60% between the best and worst postcode sectors. Bromley's borough median is £468k, but individual sectors range from under £400k to over £650k. The borough ranking tells you Bromley is worth looking at; the postcode data tells you exactly where within Bromley.
- Start with the livability ranking to build a shortlist of 5–8 boroughs that match your priorities.
- Cross-reference median prices to filter out boroughs that are outside your budget.
- Drill into postcode-level data for your shortlisted boroughs to find the best streets and sectors.
- Compare at least two candidate postcodes side by side before committing to a property.
- Check school catchments, commute times and planning applications at postcode level — these vary street by street.
FAQ
What is the best area to live in London in 2026?
Richmond upon Thames ranks as the most livable London borough in 2026 with a score of 70.6 out of 100, based on a composite index of safety, education, deprivation, employment and property signals. Kingston upon Thames (65.3) and Bromley (63.4) follow in second and third place.
What is the cheapest London borough to buy a house in 2026?
Barking and Dagenham has the lowest median property price in London at £376,000 (rolling 12-month median from Land Registry data). Newham (£432k), Bexley (£435k), Sutton (£435k) and Havering (£435k) are also among the most affordable boroughs.
Which London boroughs offer the best value for money?
Sutton (livability 61.6, median price £435k) and Bexley (60.6, £435k) offer the strongest combination of high livability and low prices. Both sit in the top five for livability but in the bottom quartile for price, making them standout value picks for buyers who can accept outer-London commute times.
How is the livability score calculated?
The livability score is a 0–100 composite index that combines five signal groups: safety (LSOA-level crime pressure), education (school quality and proximity), deprivation (IMD decile distribution), employment (economic activity rates) and property market health (transaction volume and price stability). Scores are normalised and weighted to produce a single borough-level number.
Is London property getting more expensive in 2026?
London median property prices range from £376k (Barking and Dagenham) to £1.05m (Kensington and Chelsea) as of early 2026. Price movement varies by borough: outer boroughs with strong livability scores tend to see steady demand, while prime central boroughs are more sensitive to interest rate changes and international buyer flows.
Which London boroughs are safest for families?
The safest boroughs by crime pressure score are Richmond upon Thames, Kingston upon Thames, Bromley, Havering and Harrow. These all combine low crime pressure with strong school access and lower deprivation, making them the strongest options for families willing to trade commute time for living conditions.